Introduction
Opened a stock chart for the first time and felt like you were staring at a foreign language? That was me too, staring at a mess of red and green candles wondering what any of it actually meant. Learning how to read stock charts isn’t as complicated as the finance influencers on YouTube make it sound. This guide breaks it down into the pieces that actually matter for a beginner — no unnecessary jargon.
Understanding the Basic Candlestick
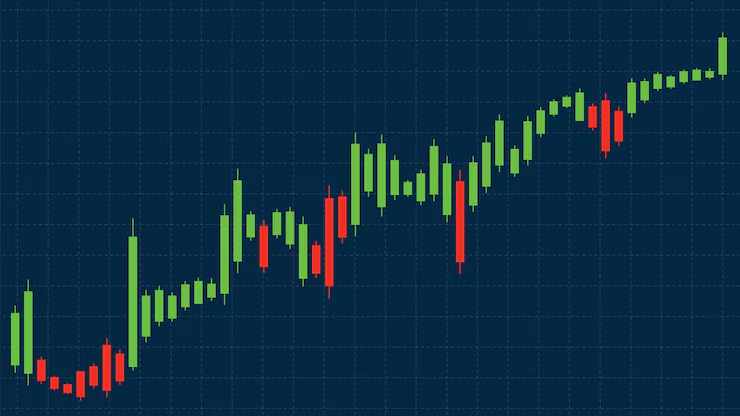
In short: Learning how to read stock charts starts with candlesticks — each one shows the opening price, closing price, and the high-low range for a specific time period, with green typically meaning the price closed higher and red meaning it closed lower.
Each candlestick has a “body” and “wicks” (also called shadows). The body shows the open-close range, and the wicks show the extreme high and low touched during that period.
Timeframes: Choosing What to Look At
- 1-minute or 5-minute charts — used by intraday traders, extremely noisy
- Daily charts — good for swing traders looking at multi-day moves
- Weekly/Monthly charts — better for long-term investors trying to spot bigger trends
If you’re a long-term investor, honestly, staring at a 5-minute chart is going to do nothing but stress you out unnecessarily.
Identifying Trends
A trend is simply the general direction prices are moving.
- Uptrend — a series of higher highs and higher lows
- Downtrend — a series of lower highs and lower lows
- Sideways/Range-bound — price bouncing between a fixed support and resistance zone
Trends aren’t perfectly straight lines, and expecting them to be is where a lot of beginners go wrong.
Support and Resistance: The Foundation
Support is a price level where a stock tends to stop falling and bounce back. Resistance is the opposite — a level where it tends to stop rising.
Picture a stock that’s bounced off ₹450 three separate times over two months. That’s a fairly strong support level, and traders watch for it to either hold again or break down, which would signal a bigger shift.
[link to related guide on intraday trading strategies here]
Volume: The Piece Beginners Ignore
Price movement without volume doesn’t mean much. A stock jumping 5% on unusually high volume signals genuine conviction from buyers; the same jump on thin volume could just be noise.
Reading Volume Bars
Most charting platforms show volume as bars beneath the price chart. Spikes usually align with news events, earnings announcements, or major institutional buying/selling.
Common Chart Patterns Worth Knowing
- Head and Shoulders — often signals a potential trend reversal
- Double Top/Bottom — indicates a possible reversal after failing to break a level twice
- Flags and Pennants — short consolidation patterns during a strong trend, often followed by continuation
I’ll be honest, pattern recognition takes months of actually watching charts to get comfortable with — don’t expect to master this in a weekend.
Moving Averages: Smoothing Out the Noise
A 50-day or 200-day moving average smooths daily price fluctuations into a cleaner trend line. When a stock’s price crosses above its 200-day moving average, some traders read it as a bullish signal — though it’s far from foolproof on its own.
[link to related guide on best intraday trading strategies here]
Putting It All Together
Learning how to read stock charts really comes down to layering these tools — trend, support/resistance, volume, and moving averages — rather than relying on any single indicator alone. No single tool gives you the full picture.
FAQs
What’s the easiest chart type for beginners to start with? Daily candlestick charts on a well-known index like Nifty 50 are a good, low-stress starting point.
Do I need to pay for charting software? No, free platforms like TradingView or your broker’s app (Zerodha Kite, Groww) offer solid free charting tools.
How long does it take to learn how to read stock charts confidently? Most people need a few months of regular practice, watching real charts daily, before patterns start feeling intuitive.
Is technical analysis more reliable than fundamental analysis? Neither is universally better — technical analysis suits shorter-term trading, while fundamentals matter more for long-term investing decisions.
Can chart patterns guarantee profits? No, chart patterns indicate probability, not certainty — false breakouts happen regularly, even with well-known patterns.
Conclusion
Learning how to read stock charts takes practice, not innate talent — nobody’s born knowing what a “double top” looks like. Start simple: get comfortable with candlesticks and trends before layering in volume and moving averages. Open a free charting tool today and just observe a stock you’re familiar with for a week — you’ll be surprised how quickly the patterns start making sense once you’re actually watching regularly.
Suggested Alt Text:
- “Candlestick stock chart showing uptrend with support and resistance”
- “Beginner analyzing stock market chart on trading platform”